1


Coulomb meter high precision designed to monitor the voltage, the capacity, the power and theenergy a battery.
The coulomb meter high precision allows the monitoring of the voltage (V), the capacity (Ah), the power (W) and theenergy a battery. This information allows the user toget a State of charge in % (SoC) or a depth of discharge (DoD) says the battery. It calculates in real time the remaining time until the battery is completely empty. The product has a memory function that records the SoC information when the device is turned off or disconnected accidentally. The CC 75/150/500 is suitable for the lithium-iron-phosphate batteries(LiFePO4), lithium-ionLi-polymer, battery lead-acid and nickel-metal hybrid with an operating voltage of 8V to 80V DC.

There are 3 versions:
The armored cable which connects to measure resistance (shunt) and the display screen is available in three lengths, depending on the location of the battery and the display):
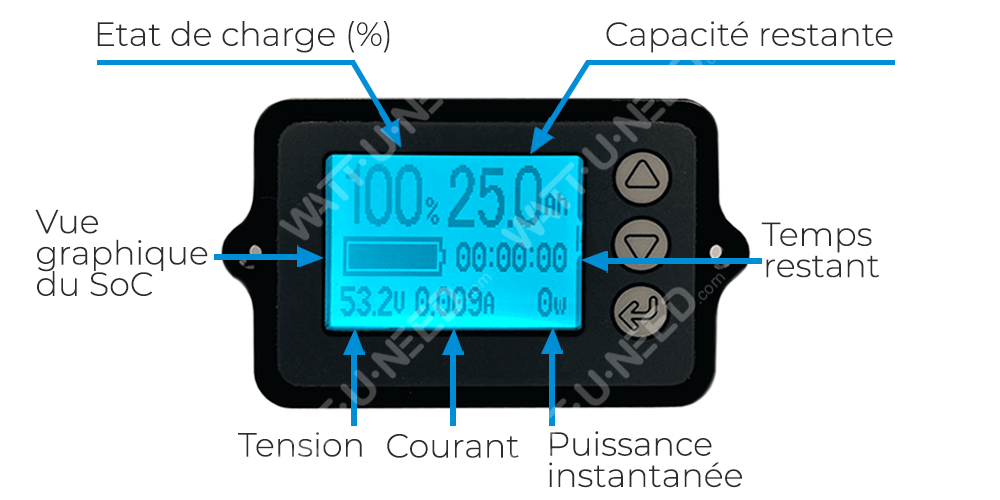
• State of charge (%)
• Remaining capacity (Ah)
• Remaining time (HH: MN: SS)
• Instantaneous power (W)
• Current (A)
• Voltage (V)
• Graphical view of the State of charge (SoC) battery
| originalwtwatermark | Min | Nominal | Max | Unit |
| Operating voltage | 1/8 | 50.0 | 80.0 | V |
| Consumption in operation (backlight ON) | 01/06/00 | My | ||
| Consumption in operation (backlight OFF) | 0.7 | My | ||
| Precision measurement of voltage | +/-1.0 | % | ||
| Precision measurement of current | +/-1.0 | % | ||
| Precision measurement of capacity | +/-1.0 | % | ||
| Measuring range of capacity | 0.1 | 999.9 | Ah | |
| Current measurement range (CC75) | 0.0 | 50.0 | 75.0 | A |
| Display operating temperature | -10 | 25 | 50 | ° C |
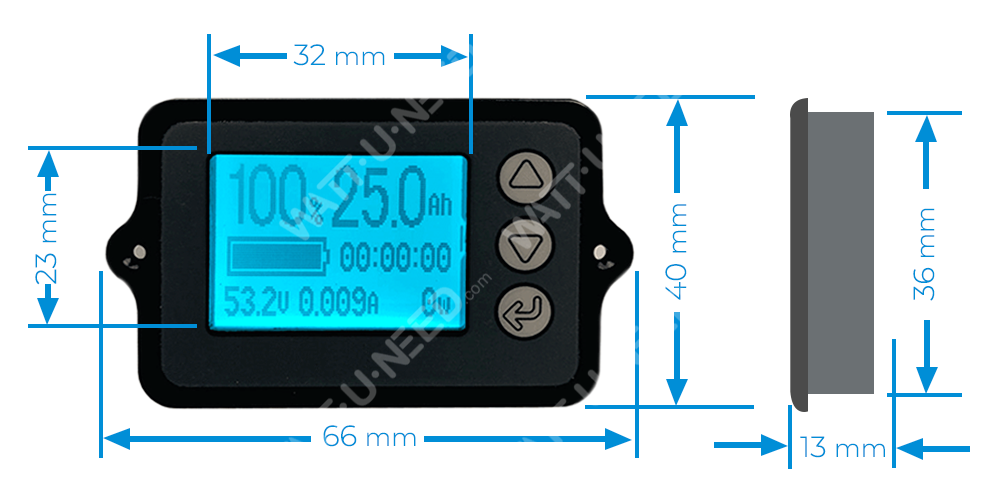
| Weight of the display | 20 | g | ||
| Dimensions of the display | 66 x 40 x 13 |
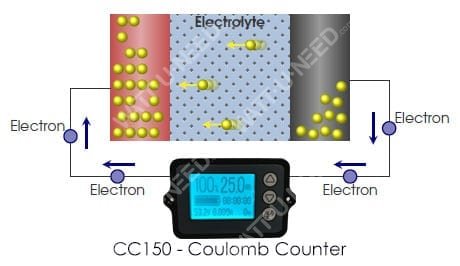
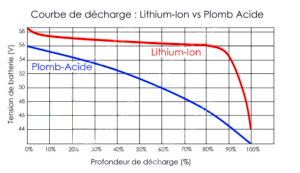
All types of batteries have one thing in common: the tension their Terminal decreases or increases based on their level of support. The voltage will be maximum when the battery is fully charged and minimal when it is empty.
This relationship between SOC and voltage is directly dependent on the used battery technology. For example, the diagram below below compares the curves of discharge between a lead battery and a Lithium-Ion batteries.
To track the State of charge when using the battery, the most intuitive method is to follow the current incorporating during the use of the cells. This integration gives directly the amount of electric charge injected or extracted to the battery allowing to precisely quantify the SoC of the battery.
Unlike the OCV method, this method is able to determine the evolution of the charge for the use of the battery State. It does not require that the battery is at rest for a precise measurement.